Note
Go to the end to download the full example code.
Basic Usage Example#
This is a basic usage example of the random-shapes package.
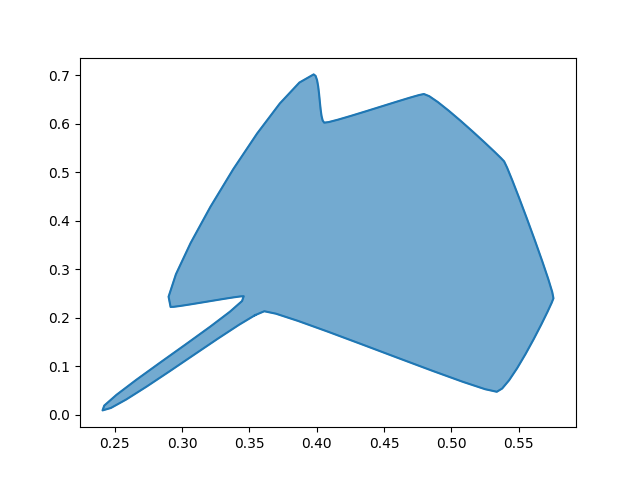
With random-shapes it is easy to generate a random shape (bezier.Curve):
import matplotlib.pyplot as plt

from random_shapes import Shape

shp = Shape.random(n=10, r=0.05, edgy=0.2)
# Shape.curve is a bezier.CurvedPolygon, since Shape is a just wrapper
shp.curve.plot(pts_per_edge=10)
<Axes: >
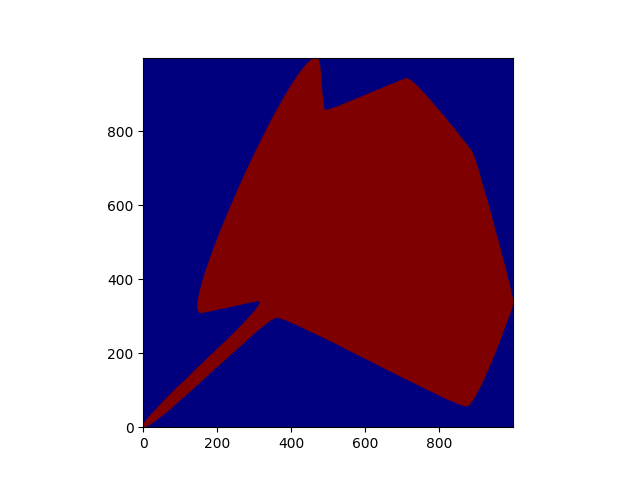
This shape can then be turned into a binary image:
img = shp.rasterize(1000, 1000)
plt.imshow(img, cmap="jet", origin="lower")
<matplotlib.image.AxesImage object at 0x7f7288f29090>
Shapes can be generated with through 3 parameters:
n: number of control points
r: curvature of the control points
edgy: how edgy the shape is
import matplotlib as mpl
import matplotlib.colors as mcolors
import numpy as np
# Create a 6 color color map based on jet but with white at the first position
nc = 10
cmap = mpl.colormaps.get_cmap("jet")
colors = cmap(np.linspace(0, 1, nc))
colors[0] = np.array([1, 1, 1, 1])
cmap = mcolors.LinearSegmentedColormap.from_list("mycmap", colors)
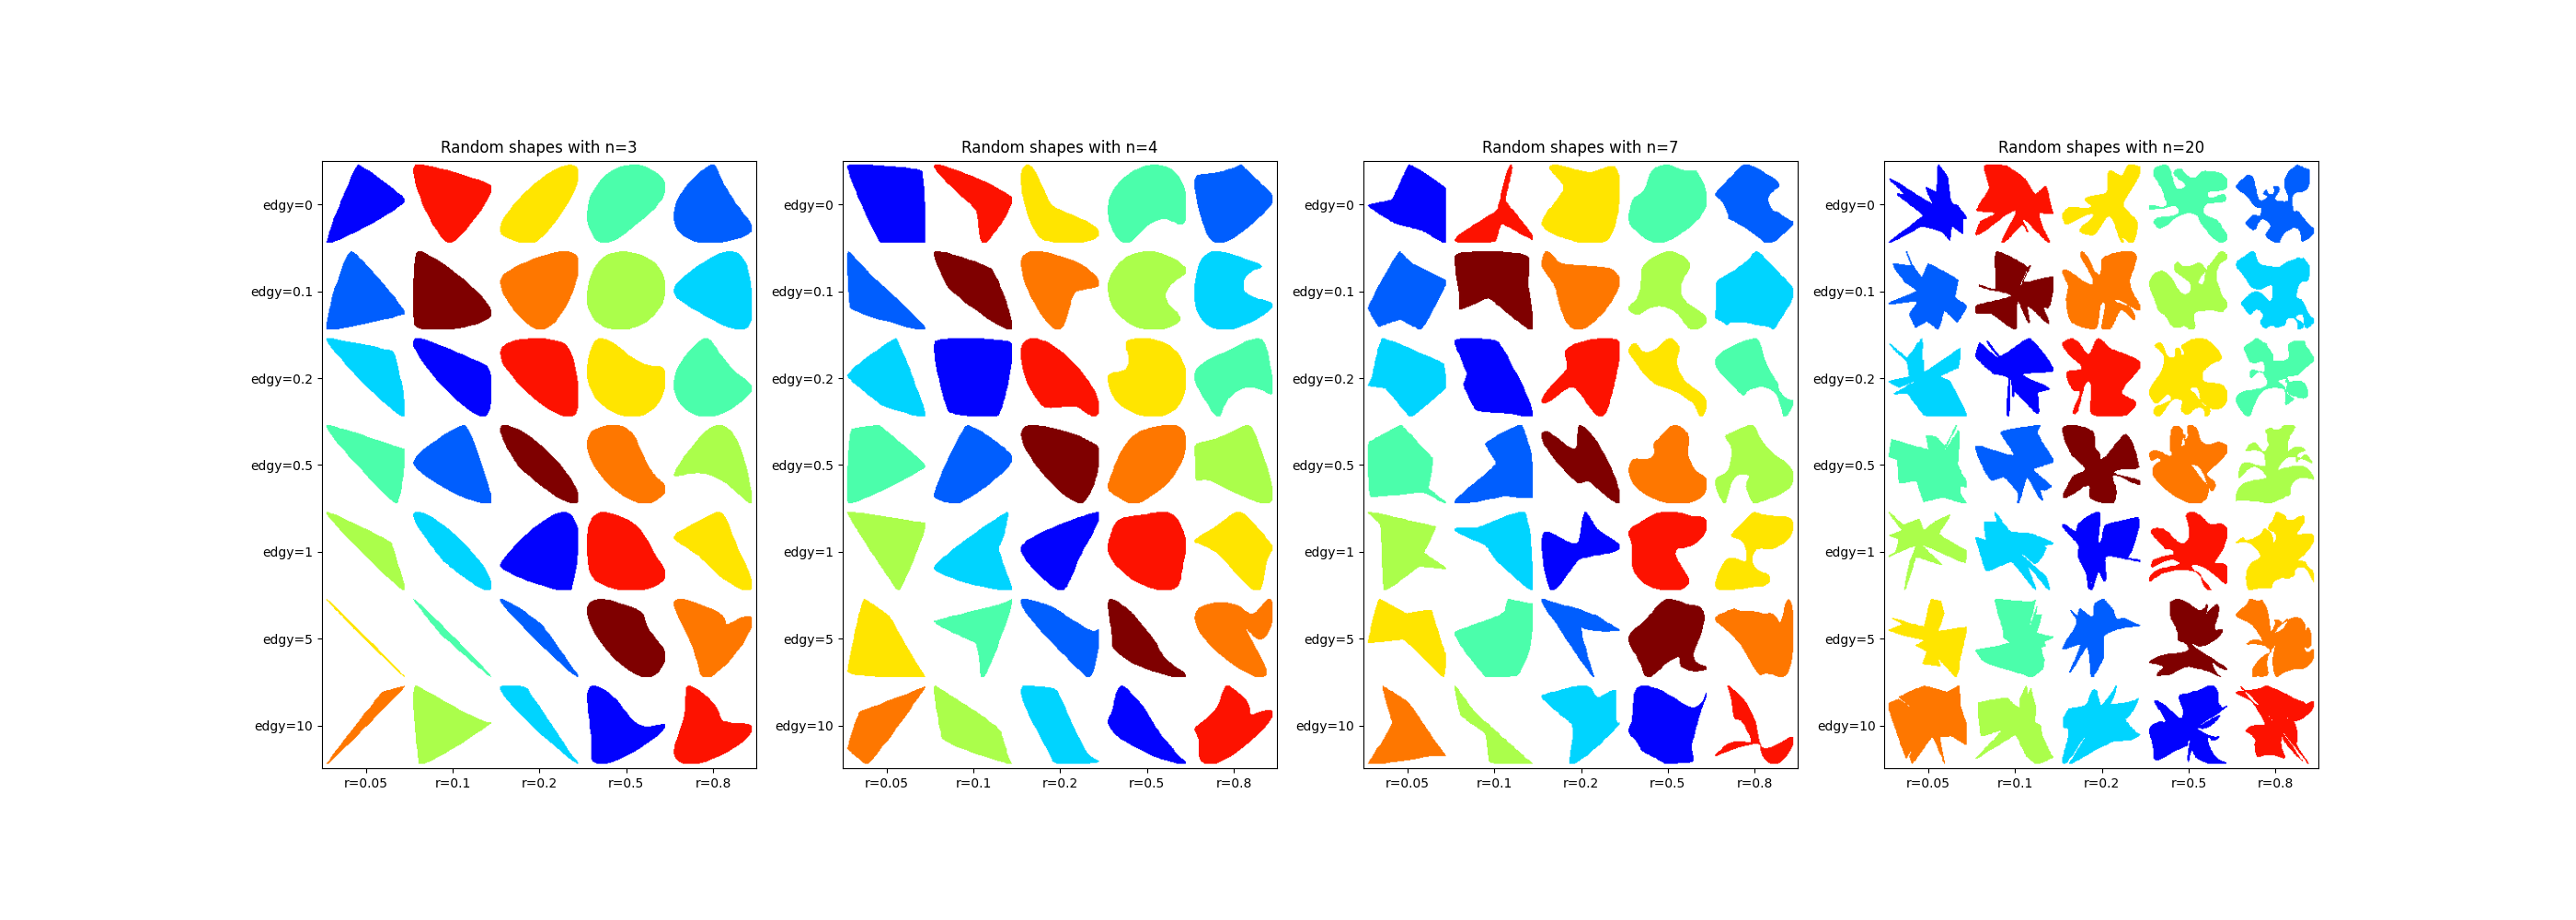
n_vals = [3, 4, 7, 20]
r_vals = [0.05, 0.1, 0.2, 0.5, 0.8]
edgy_vals = [0, 0.1, 0.2, 0.5, 1, 5, 10]
fig, axs = plt.subplots(ncols=len(n_vals), figsize=(7 * len(n_vals), 10))
axs = axs.flatten()
for k, n in enumerate(n_vals):
img = np.zeros((len(r_vals) * 100, len(edgy_vals) * 100))
for i, r in enumerate(r_vals):
for j, edgy in enumerate(edgy_vals):
c = ((i * 7 + j) % (nc - 1) + 1) / nc
shp = Shape.random(n=n, r=r, edgy=edgy)
shp_img = shp.rasterize(90, 90) * c
img[i * 100 + 5 : (i + 1) * 100 - 5, j * 100 + 5 : (j + 1) * 100 - 5] = shp_img
ax = axs[k]
ax.imshow(img.T, cmap=cmap)
ax.set_xticks(np.arange(50, img.shape[0], 100), [f"r={r}" for r in r_vals])
ax.set_yticks(np.arange(50, img.shape[1], 100), [f"edgy={edgy}" for edgy in edgy_vals])
ax.set_title(f"Random shapes with {n=}")